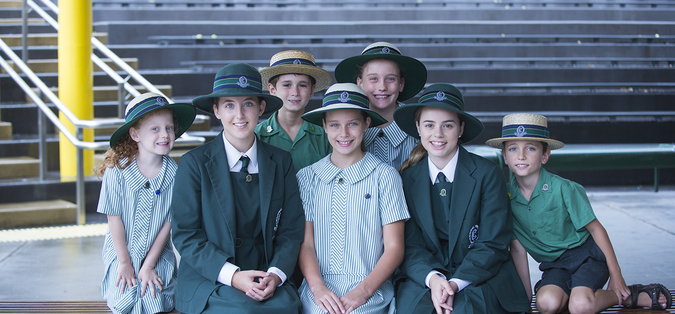
Clayfield College Top 50

Compare Independent Pre-Prep - Year 12 Coeducational , Boarding and Homestay School

School TypeCombined
Year RangeU, Prep-12
AddressGREGORY STREET Clayfield QLD 4011
Phone07 3262 0262
Website http://www.clayfield.qld.edu.au
GenderCo-Education
RegionMetropolitan
Students758
Boys69
Girls689
ICSEA Value1153
Aus. Average1000
Finances per student$22,026
Aus. Average per student$17,550
Australian Government19%
State/Territory Government8%
Fees, parent contributions etc70%
Others4%
School Ranking History for Clayfield College
2015 2014 2013
NAPLAN (Primary) N/A N/A N/A
NAPLAN (Secondary) N/A N/A N/A
OPs|QCE N/A N/A N/A
Student Distribution for Clayfield College
Total Enrollments (Approx): 758; Full Time Student Teacher Ratio: 8.8/1
ICSEA Score: 1153;
Students of Non-English Speaking Background in 2015 NAPLAN tests: 9%
Bottom Quarter Middle Quarters Top Quarter
Student Distribution 2% 6% 22% 70%
Australian Average 25% 25% 25% 25%
Total Enrollments (Approx): 863; Full Time Student Teacher Ratio: 10.9/1
ICSEA Score: 1155;
Students of Non-English Speaking Background in 2014 NAPLAN tests: 18%
Bottom Quarter Middle Quarters Top Quarter
Student Distribution 1% 6% 23% 70%
Australian Average 25% 25% 25% 25%
Total Enrollments (Approx): 880; Full Time Student Teacher Ratio: 11.8/1
Student Attendence Rate: 95%
ICSEA Score: 1165;
Students of Non-English Speaking Background in 2013 NAPLAN tests: 7%
Bottom Quarter Middle Quarters Top Quarter
Student Distribution 1% 6% 21% 72%
Australian Average 25% 25% 25% 25%
Total Enrollments (Approx): 892; Full Time Student Teacher Ratio: 11.5/1
Student Attendence Rate: 95%
ICSEA Score: 1153;
Students of Non-English Speaking Background in 2012 NAPLAN tests: 9%
Bottom Quarter Middle Quarters Top Quarter
Student Distribution 1% 5% 25% 69%
Australian Average 25% 25% 25% 25%
Total Enrollments (Approx): 910; Full Time Student Teacher Ratio: 11.3/1
Student Attendence Rate: 96%
ICSEA Score: 1152;
Students of Non-English Speaking Background in 2011 NAPLAN tests: 5%
Bottom Quarter Middle Quarters Top Quarter
Student Distribution 1% 3% 28% 67%
Australian Average 25% 25% 25% 25%
Total Enrollments (Approx): 905; Full Time Student Teacher Ratio: 11/1
Student Attendence Rate: 96%
ICSEA Score: 1151;
Students of Non-English Speaking Background in 2010 NAPLAN tests: 10%
Bottom Quarter Middle Quarters Top Quarter
Student Distribution 4% 7% 22% 67%
Australian Average 25% 25% 25% 25%
Total Enrollments (Approx): 943; Full Time Student Teacher Ratio: 11.4/1
Student Attendence Rate: 95%
ICSEA Score: 1086;
Students of Non-English Speaking Background in 2009 NAPLAN tests: 10%
Bottom Quarter Middle Quarters Top Quarter
Student Distribution 7% 16% 31% 46%
Australian Average 25% 25% 25% 25%
Student Distribution

2015

70%Top Quarter

  • ICSEA Score1153
  • Attendence RateN/A
  • Enrollments758
  • Non-English Speaking9%
  • Top Quarter70%
  • Middle Top Quarter22%
  • Middle Bottom Quarter6%
  • Bottom Quarter2%

2014

70%Top Quarter

  • ICSEA Score1155
  • Attendence RateN/A
  • Enrollments863
  • Non-English Speaking18%
  • Top Quarter70%
  • Middle Top Quarter23%
  • Middle Bottom Quarter6%
  • Bottom Quarter1%

2013

72%Top Quarter

  • ICSEA Score1165
  • Attendence Rate95%
  • Enrollments880
  • Non-English Speaking7%
  • Top Quarter72%
  • Middle Top Quarter21%
  • Middle Bottom Quarter6%
  • Bottom Quarter1%

2012

69%Top Quarter

  • ICSEA Score1153
  • Attendence Rate95%
  • Enrollments892
  • Non-English Speaking9%
  • Top Quarter69%
  • Middle Top Quarter25%
  • Middle Bottom Quarter5%
  • Bottom Quarter1%

2011

67%Top Quarter

  • ICSEA Score1152
  • Attendence Rate96%
  • Enrollments910
  • Non-English Speaking5%
  • Top Quarter67%
  • Middle Top Quarter28%
  • Middle Bottom Quarter3%
  • Bottom Quarter1%

2010

67%Top Quarter

  • ICSEA Score1151
  • Attendence Rate96%
  • Enrollments905
  • Non-English Speaking10%
  • Top Quarter67%
  • Middle Top Quarter22%
  • Middle Bottom Quarter7%
  • Bottom Quarter4%

2009

46%Top Quarter

  • ICSEA Score1086
  • Attendence Rate95%
  • Enrollments943
  • Non-English Speaking10%
  • Top Quarter46%
  • Middle Top Quarter31%
  • Middle Bottom Quarter16%
  • Bottom Quarter7%
NAPLAN Ranking - Primary Schools
2009

Rank 28th Primary Schools In QLD

  • Overall 73
  • Reading 74
  • Writing 78
  • Language 69
  • Numeracy 71
2010

Rank 43rd Primary Schools In QLD

  • Overall 71
  • Reading 75
  • Writing 74
  • Language 67
  • Numeracy 68
2011

Rank 27th Primary Schools In QLD

  • Overall 76
  • Reading 78
  • Writing 84
  • Language 73
  • Numeracy 70
2012

Rank 53rd Primary Schools In QLD

  • Overall 69
  • Reading 71
  • Writing 69
  • Language 67
  • Numeracy 70
2013

Rank 29th Primary Schools In QLD

  • Overall 78
  • Reading 75
  • Writing 83
  • Language 75
  • Numeracy 78
2014

Rank 46th Primary Schools In QLD

  • Overall 75
  • Reading 72
  • Writing 83
  • Language 74
  • Numeracy 71
2015

Rank 19th Primary Schools In QLD

  • Overall 78
  • Reading 77
  • Writing 85
  • Language 76
  • Numeracy 73
NAPLAN Ranking - Secondary Schools
2009

Rank 46th Secondary Schools In QLD

  • Overall 69
  • Reading 64
  • Writing 82
  • Language 78
  • Numeracy 58
2010

Rank 38th Secondary Schools In QLD

  • Overall 74
  • Reading 78
  • Writing 72
  • Language 81
  • Numeracy 67
2011

Rank 16th Secondary Schools In QLD

  • Overall 83
  • Reading 81
  • Writing 100
  • Language 78
  • Numeracy 74
2012

Rank 45th Secondary Schools In QLD

  • Overall 70
  • Reading 72
  • Writing 79
  • Language 70
  • Numeracy 61
2013

Rank 29th Secondary Schools In QLD

  • Overall 78
  • Reading 71
  • Writing 99
  • Language 75
  • Numeracy 68
2014

Rank 42nd Secondary Schools In QLD

  • Overall 70
  • Reading 64
  • Writing 88
  • Language 69
  • Numeracy 62
2015

Rank 49th Secondary Schools In QLD

  • Overall 69
  • Reading 69
  • Writing 91
  • Language 70
  • Numeracy 52
OPs|QCE Ranking - High Schools
2009

Rank 20th 2009 qce Ranking

  • Total Students 110
  • %OP 1~5 30.2
  • %OP 1~10 56.6
  • %OP 1~15 78.0
2010

Rank 17th 2010 qce Ranking

  • Total Students 67
  • %OP 1~5 33.3
  • %OP 1~10 68.3
  • %OP 1~15 87.0
2011

Rank 71st 2011 qce Ranking

  • Total Students 70
  • %OP 1~5 22.6
  • %OP 1~10 51.6
  • %OP 1~15 77.4
2012

Rank N/A 2012 QCE Ranking

  • Total Students N/A
  • %OP 1~5 N/A
  • %OP 1~10 N/A
  • %OP 1~15 N/A
2013

Rank 13th 2013 qce Ranking

  • Total Students 81
  • %OP 1~5 37.3
  • %OP 1~10 71.2
  • %OP 1~15 88.1
2014

Rank 6th 2014 qce Ranking

  • Total Students 90
  • %OP 1~5 42.4
  • %OP 1~10 72.7
  • %OP 1~15 87.9
2015

Rank 143rd 2015 qce Ranking

  • Total Students 78
  • %OP 1~5 18.5
  • %OP 1~10 61.1
  • %OP 1~15 88.9

Clayfield College, established in 1931, provides a quality education for girls from Pre-prep to Year 12 and for boys from Pre-prep to Year 5. Boarding is available for girls from Year 5 to Year 12.

Clayfield College has a strong academic emphasis, where students are encouraged to set and achieve personal goals within the academic arena. This approach has successfully ensured strong academic results over many years for Clayfield College students. In 2012, approximately one third of the Year 12 cohort received an OP 1–5, with in excess of 96 per cent of the students gaining acceptance into tertiary courses.

Clayfield College offers a comprehensive sporting, cultural and co-curricular program where all students are encouraged to strive for excellence. The Elite Sport Program and Music Program are renowned.

The cornerstone of a Clayfield education is the nurturing pastoral care program, where every student is valued and contributes to the enviable reputation of Clayfield as a boarding school.
 

Key Facts

Costs

Year 10 are $14,580
Year 12 are $14,580

International Fee

Year 10 are $26,520
Year 12 are $26,520

Uniform

The uniform is compulsory and enforced

Size

913 students,
362 up to Year 6,
551 in secondary (Average)
103 in Year 12

Gender

100% girls

Overview of the Curriculum

Math classes are of mixed ability.
English classes are of mixed ability.

Languages: Chinese, German, Japanese

Overview of senior secondary subjects

LOTE taught to Unit 4 level: Chinese, German, Japanese

Activities and Support

15 music options; 16 sporting activities; 23 other clubs or activities; 15 support staff.

Destinations

96% to university
2% to TAFE
2% to work

Schools closest to Clayfield College

School name Address Type Sector Distance
Eagle Junction State SchoolTop 100 ROSEBY AVENUEClayfield 4011 Primary Government 0.41 km
St Rita's CollegeTop 50 ENDERLEY ROADClayfield 4011 Secondary Catholic 0.54 km
St Agatha's Primary School 6 HUNTER LANEClayfield 4011 Primary Catholic 0.67 km
St Margaret's Anglican Girls SchoolTop 50 11 PETRIE STREETAscot 4007 Combined Independent 1.12 km
Aviation High WIDDOP STREETClayfield 4011 Secondary Government 1.14 km
Ascot State School PRINGLE STREETAscot 4007 Primary Government 1.42 km
Our Lady Help of Christians School 23 BOWMAN STREETHendra 4011 Primary Catholic 1.36 km
Holy Cross School 40 MORRIS STREETWooloowin 4030 Primary Catholic 1.38 km
Kedron State High School PARK ROADWooloowin 4030 Secondary Government 1.6 km
Wooloowin State School LUTWYCHE ROADLUTWYCHE 4030 Primary Government 1.69 km