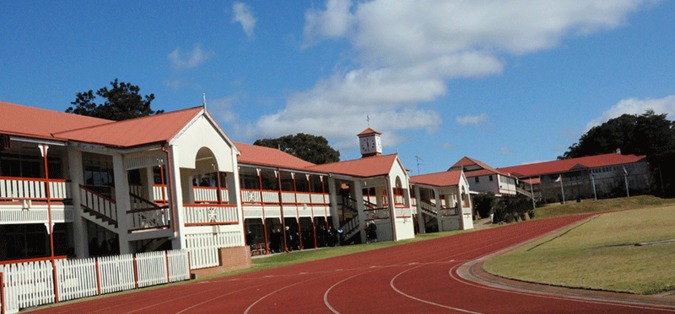
The Glennie School Top 50

Compare Independent P-12 Female School

School TypeCombined
Year RangeU, Prep-12
AddressHERRIES STREET Toowoomba QLD 4350
Phone+61 7 4688 8846
Website http://www.glennie.qld.edu.au
GenderFemale
RegionProvincial
Students825
Boys0
Girls825
ICSEA Value1102
Aus. Average1000
Finances per student$18,576
Aus. Average per student$17,550
Australian Government35%
State/Territory Government11%
Fees, parent contributions etc50%
Others4%
School Ranking History for The Glennie School
2015 2014 2013
NAPLAN (Primary) N/A N/A N/A
NAPLAN (Secondary) N/A N/A N/A
OPs|QCE N/A N/A N/A
Student Distribution for The Glennie School
Total Enrollments (Approx): 825; Full Time Student Teacher Ratio: 11.7/1
ICSEA Score: 1102;
Students of Non-English Speaking Background in 2015 NAPLAN tests: 3%
Bottom Quarter Middle Quarters Top Quarter
Student Distribution 4% 17% 34% 44%
Australian Average 25% 25% 25% 25%
Total Enrollments (Approx): 831; Full Time Student Teacher Ratio: 12/1
ICSEA Score: 1092;
Students of Non-English Speaking Background in 2014 NAPLAN tests: 8%
Bottom Quarter Middle Quarters Top Quarter
Student Distribution 5% 20% 33% 42%
Australian Average 25% 25% 25% 25%
Total Enrollments (Approx): 815; Full Time Student Teacher Ratio: 12.7/1
Student Attendence Rate: 98%
ICSEA Score: 1087;
Students of Non-English Speaking Background in 2013 NAPLAN tests: 10%
Bottom Quarter Middle Quarters Top Quarter
Student Distribution 6% 20% 33% 41%
Australian Average 25% 25% 25% 25%
Total Enrollments (Approx): 785; Full Time Student Teacher Ratio: 12.8/1
Student Attendence Rate: 96%
ICSEA Score: 1107;
Students of Non-English Speaking Background in 2012 NAPLAN tests: 6%
Bottom Quarter Middle Quarters Top Quarter
Student Distribution 5% 17% 42% 36%
Australian Average 25% 25% 25% 25%
Total Enrollments (Approx): 780; Full Time Student Teacher Ratio: 12.8/1
Student Attendence Rate: 97%
ICSEA Score: 1122;
Students of Non-English Speaking Background in 2011 NAPLAN tests: 6%
Bottom Quarter Middle Quarters Top Quarter
Student Distribution 5% 21% 31% 43%
Australian Average 25% 25% 25% 25%
Total Enrollments (Approx): 742; Full Time Student Teacher Ratio: 12.5/1
Student Attendence Rate: 93%
ICSEA Score: 1128;
Students of Non-English Speaking Background in 2010 NAPLAN tests: 2%
Bottom Quarter Middle Quarters Top Quarter
Student Distribution 10% 13% 33% 44%
Australian Average 25% 25% 25% 25%
Total Enrollments (Approx): 708; Full Time Student Teacher Ratio: 12.3/1
Student Attendence Rate: 91%
ICSEA Score: 1044;
Students of Non-English Speaking Background in 2009 NAPLAN tests: 6%
Bottom Quarter Middle Quarters Top Quarter
Student Distribution 15% 17% 38% 30%
Australian Average 25% 25% 25% 25%
Student Distribution

2015

44%Top Quarter

  • ICSEA Score1102
  • Attendence RateN/A
  • Enrollments825
  • Non-English Speaking3%
  • Top Quarter44%
  • Middle Top Quarter34%
  • Middle Bottom Quarter17%
  • Bottom Quarter4%

2014

42%Top Quarter

  • ICSEA Score1092
  • Attendence RateN/A
  • Enrollments831
  • Non-English Speaking8%
  • Top Quarter42%
  • Middle Top Quarter33%
  • Middle Bottom Quarter20%
  • Bottom Quarter5%

2013

41%Top Quarter

  • ICSEA Score1087
  • Attendence Rate98%
  • Enrollments815
  • Non-English Speaking10%
  • Top Quarter41%
  • Middle Top Quarter33%
  • Middle Bottom Quarter20%
  • Bottom Quarter6%

2012

36%Top Quarter

  • ICSEA Score1107
  • Attendence Rate96%
  • Enrollments785
  • Non-English Speaking6%
  • Top Quarter36%
  • Middle Top Quarter42%
  • Middle Bottom Quarter17%
  • Bottom Quarter5%

2011

43%Top Quarter

  • ICSEA Score1122
  • Attendence Rate97%
  • Enrollments780
  • Non-English Speaking6%
  • Top Quarter43%
  • Middle Top Quarter31%
  • Middle Bottom Quarter21%
  • Bottom Quarter5%

2010

44%Top Quarter

  • ICSEA Score1128
  • Attendence Rate93%
  • Enrollments742
  • Non-English Speaking2%
  • Top Quarter44%
  • Middle Top Quarter33%
  • Middle Bottom Quarter13%
  • Bottom Quarter10%

2009

30%Top Quarter

  • ICSEA Score1044
  • Attendence Rate91%
  • Enrollments708
  • Non-English Speaking6%
  • Top Quarter30%
  • Middle Top Quarter38%
  • Middle Bottom Quarter17%
  • Bottom Quarter15%
NAPLAN Ranking - Primary Schools
2009

Rank 145th Primary Schools In QLD

  • Overall 59
  • Reading 58
  • Writing 63
  • Language 62
  • Numeracy 54
2010

Rank 56th Primary Schools In QLD

  • Overall 69
  • Reading 72
  • Writing 76
  • Language 68
  • Numeracy 61
2011

Rank 115th Primary Schools In QLD

  • Overall 64
  • Reading 64
  • Writing 74
  • Language 67
  • Numeracy 53
2012

Rank 163rd Primary Schools In QLD

  • Overall 59
  • Reading 63
  • Writing 56
  • Language 64
  • Numeracy 56
2013

Rank 148th Primary Schools In QLD

  • Overall 63
  • Reading 67
  • Writing 63
  • Language 66
  • Numeracy 59
2014

Rank 169th Primary Schools In QLD

  • Overall 61
  • Reading 65
  • Writing 64
  • Language 63
  • Numeracy 53
2015

Rank 66th Primary Schools In QLD

  • Overall 72
  • Reading 76
  • Writing 72
  • Language 75
  • Numeracy 67
NAPLAN Ranking - Secondary Schools
2009

Rank 13th Secondary Schools In QLD

  • Overall 81
  • Reading 82
  • Writing 93
  • Language 82
  • Numeracy 71
2010

Rank 23rd Secondary Schools In QLD

  • Overall 80
  • Reading 80
  • Writing 89
  • Language 81
  • Numeracy 72
2011

Rank 64th Secondary Schools In QLD

  • Overall 69
  • Reading 66
  • Writing 94
  • Language 61
  • Numeracy 55
2012

Rank 30th Secondary Schools In QLD

  • Overall 74
  • Reading 80
  • Writing 77
  • Language 80
  • Numeracy 62
2013

Rank 81st Secondary Schools In QLD

  • Overall 63
  • Reading 63
  • Writing 80
  • Language 66
  • Numeracy 47
2014

Rank 36th Secondary Schools In QLD

  • Overall 73
  • Reading 67
  • Writing 95
  • Language 75
  • Numeracy 59
2015

Rank 46th Secondary Schools In QLD

  • Overall 70
  • Reading 65
  • Writing 95
  • Language 69
  • Numeracy 56
OPs|QCE Ranking - High Schools
2009

Rank 54th 2009 qce Ranking

  • Total Students 76
  • %OP 1~5 23.9
  • %OP 1~10 55.2
  • %OP 1~15 78.9
2010

Rank 51st 2010 qce Ranking

  • Total Students 75
  • %OP 1~5 25.7
  • %OP 1~10 54.3
  • %OP 1~15 74.0
2011

Rank 81st 2011 qce Ranking

  • Total Students 86
  • %OP 1~5 21.6
  • %OP 1~10 51.4
  • %OP 1~15 83.8
2012

Rank N/A 2012 QCE Ranking

  • Total Students N/A
  • %OP 1~5 N/A
  • %OP 1~10 N/A
  • %OP 1~15 N/A
2013

Rank 94th 2013 qce Ranking

  • Total Students 78
  • %OP 1~5 22.2
  • %OP 1~10 58.3
  • %OP 1~15 84.7
2014

Rank 92nd 2014 qce Ranking

  • Total Students 86
  • %OP 1~5 22.2
  • %OP 1~10 48.1
  • %OP 1~15 74.0
2015

Rank 62nd 2015 qce Ranking

  • Total Students 90
  • %OP 1~5 26.3
  • %OP 1~10 53.8
  • %OP 1~15 85.0

About The Glennie School

As an Anglican all-girls day and boarding school from Prep to Year 12, located in Toowoomba, Queensland, The Glennie School provides a well-rounded Primary and Secondary education, framed by the Christian values within the Anglican ethos.

Our vision is to develop in each Glennie girl intellectual, physical and spiritual potential to be All She Can Be. Glennie girls are to be educated to the highest academic standards of which they are capable.

We combine quality and value in all that we offer with opportunities for girls to develop their academic and co-curricular (sporting and cultural) talents. This is achieved by providing a rich, diverse and relevant education and pastoral care program.

Glennie has 105 years of experience in providing a welcoming a second home for boarders. Commencing in Year 6, boarders at Glennie benefit from many opportunities to learn and grow as individuals. Great friendships are formed within this vibrant and inclusive community. These friendships endure for a lifetime.

www.glennie.qld.edu.au

Key Facts

International Fee

Year 12 are $22

Uniform

The uniform is compulsory and enforced

Size

830 students,
280 up to Year 6,
550 in secondary (Average)
90 in Year 12

Gender

100% girls

Overview of the Curriculum

Math classes are streamed.
English classes are of mixed ability.

Languages: French, French Second Language, Japanese

Activities and Support

14 music options; 58 sporting activities; 74 other clubs or activities; 82 support staff.

Destinations

85% to university
10% to TAFE
5% to work

Schools closest to The Glennie School

School name Address Type Sector Distance
Newtown State School ALBERT STREETTOOWOOMBA 4350 Primary Government 0.31 km
Our Lady of Lourdes Primary School 2 ASCOT STToowoomba 4350 Primary Catholic 0.63 km
St Mary's College 286 MARGARET STREETToowoomba 4350 Combined Catholic 0.6 km
St Ursula's CollegeTop 100 38 TAYLOR STREETToowoomba 4350 Secondary Catholic 0.84 km
St Anthony's School 9 MEMORY STREETToowoomba 4350 Primary Catholic 1.19 km
Harristown State School SOUTH STREETTOOWOOMBA 4350 Primary Government 1.31 km
Harristown State High School SOUTH STREETToowoomba 4350 Secondary Government 1.31 km
Harristown State High School Harristown 4350 Secondary Government 1.35 km
Concordia Lutheran College 154 STEPHEN STREETToowoomba 4350 Combined Independent 1.38 km
Toowoomba North State School CNR MORT AND TAYLOR STREETSToowoomba 4350 Primary Government 1.39 km